Hornady Hornady Match 6.5 Creedmoor Ammo 147 Grain Hornady ELD Match
Ammunition
 Brand
Brand Ammo
Ammo- Ammunition
- Hornady Hornady Match 6.5 Creedmoor Ammo 147 Grain Hornady ELD Match
- Caliber
- 6.5 Creedmoor
- Grain Weight
- 147gr
- Lot Number
- -
Firearm
- Description
- Tikka 6.5 cm w Outlier 24" in MDT w R65k
- Barrel
- 24" / 1:7
- Muzzle Brake
- No
- Suppressor
- Yes
Ballistics Data
- Average FPS
- 2630
- Extreme Spread
- -
- Std Dev
- 16
- Total Shots
- 20
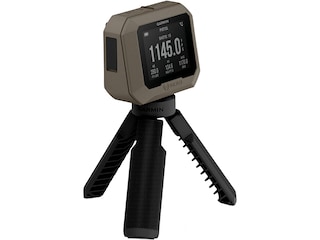 Recorded with: Garmin Xero C1 Pro Chronograph
Shot Groups
Collective @ 100 yards
POA-aligned across 4 of 4 groups
- Group Size
- 1.917"
- 1.92 MOA
- Mean Radius
- 0.540"
- 0.54 MOA
- Shots
- 20
Precision (group size, MR) isn't affected by this offset — that's your zero, a separate variable from how tightly the rifle groups.
Mixed — within-string dispersion and between-string drift contribute similarly. Both dispersion and drift are worth investigating.
Hit probability matrix — Collective @ 100yd · 20 shots · MR 0.540″
Assumes shooter dispersion is the dominant error source and scales linearly with range. Doesn't model wind, MV SD, or BC uncertainty — those matter more as distance grows, so real-world hit rates at long range will typically be lower than shown.
| Range | 0.5 MOA | 1 MOA | 2 MOA | 8" | 10" | IPSC A |
|---|---|---|---|---|---|---|
| 100 yd (measured) | 16% | 49% | 93% | ≥99% | ≥99% | ≥99% |
| 200 yd | 16% | 49% | 93% | ≥99% | ≥99% | ≥99% |
| 300 yd | 16% | 49% | 93% | 99% | ≥99% | 98% |
| 400 yd | 16% | 49% | 93% | 93% | 99% | 92% |
| 500 yd | 16% | 49% | 93% | 82% | 93% | 83% |
| 600 yd | 16% | 49% | 93% | 70% | 85% | 73% |
| 700 yd | 16% | 49% | 93% | 59% | 75% | 63% |
| 800 yd | 16% | 49% | 93% | 49% | 65% | 55% |
| 900 yd | 16% | 49% | 93% | 41% | 57% | 47% |
| 1000 yd | 16% | 49% | 93% | 35% | 49% | 41% |
| 1100 yd | 16% | 49% | 93% | 30% | 43% | 36% |
| 1200 yd | 16% | 49% | 93% | 26% | 37% | 31% |
Collective @ 300 yards
POA-aligned across 4 of 4 groups
- Group Size
- 7.872"
- 2.62 MOA
- Mean Radius
- 1.281"
- 0.43 MOA
- Shots
- 20
Precision (group size, MR) isn't affected by this offset — that's your zero, a separate variable from how tightly the rifle groups.
Consistent — shot dispersion within each string dominates. Group centers land close together.
Hit probability matrix — Collective @ 300yd · 20 shots · MR 1.281″
Assumes shooter dispersion is the dominant error source and scales linearly with range. Doesn't model wind, MV SD, or BC uncertainty — those matter more as distance grows, so real-world hit rates at long range will typically be lower than shown.
| Range | 0.5 MOA | 1 MOA | 2 MOA | 8" | 10" | IPSC A |
|---|---|---|---|---|---|---|
| 100 yd | 24% | 66% | 99% | ≥99% | ≥99% | ≥99% |
| 200 yd | 24% | 66% | 99% | ≥99% | ≥99% | ≥99% |
| 300 yd (measured) | 24% | 66% | 99% | ≥99% | ≥99% | ≥99% |
| 400 yd | 24% | 66% | 99% | 99% | ≥99% | 97% |
| 500 yd | 24% | 66% | 99% | 94% | 99% | 92% |
| 600 yd | 24% | 66% | 99% | 85% | 95% | 85% |
| 700 yd | 24% | 66% | 99% | 76% | 89% | 78% |
| 800 yd | 24% | 66% | 99% | 66% | 81% | 70% |
| 900 yd | 24% | 66% | 99% | 57% | 74% | 62% |
| 1000 yd | 24% | 66% | 99% | 50% | 66% | 56% |
| 1100 yd | 24% | 66% | 99% | 43% | 59% | 49% |
| 1200 yd | 24% | 66% | 99% | 38% | 53% | 44% |
Group 1
- Group Size
- 1.143"
- 1.14 MOA
- Mean Radius
- 0.424"
- 0.42 MOA
- Shots
- 5
Hit probability matrix — Group 1 · 100yd · MR 0.424″
Assumes shooter dispersion is the dominant error source and scales linearly with range. Doesn't model wind, MV SD, or BC uncertainty — those matter more as distance grows, so real-world hit rates at long range will typically be lower than shown.
| Range | 0.5 MOA | 1 MOA | 2 MOA | 8" | 10" | IPSC A |
|---|---|---|---|---|---|---|
| 100 yd (measured) | 24% | 66% | 99% | ≥99% | ≥99% | ≥99% |
| 200 yd | 24% | 66% | 99% | ≥99% | ≥99% | ≥99% |
| 300 yd | 24% | 66% | 99% | ≥99% | ≥99% | ≥99% |
| 400 yd | 24% | 66% | 99% | 99% | ≥99% | 97% |
| 500 yd | 24% | 66% | 99% | 94% | 99% | 92% |
| 600 yd | 24% | 66% | 99% | 86% | 95% | 85% |
| 700 yd | 24% | 66% | 99% | 76% | 89% | 78% |
| 800 yd | 24% | 66% | 99% | 66% | 82% | 70% |
| 900 yd | 24% | 66% | 99% | 58% | 74% | 63% |
| 1000 yd | 24% | 66% | 99% | 50% | 66% | 56% |
| 1100 yd | 24% | 66% | 99% | 44% | 59% | 50% |
| 1200 yd | 24% | 66% | 99% | 38% | 53% | 45% |
Group 2
- Group Size
- 1.557"
- 1.56 MOA
- Mean Radius
- 0.532"
- 0.53 MOA
- Shots
- 5
Hit probability matrix — Group 2 · 100yd · MR 0.532″
Assumes shooter dispersion is the dominant error source and scales linearly with range. Doesn't model wind, MV SD, or BC uncertainty — those matter more as distance grows, so real-world hit rates at long range will typically be lower than shown.
| Range | 0.5 MOA | 1 MOA | 2 MOA | 8" | 10" | IPSC A |
|---|---|---|---|---|---|---|
| 100 yd (measured) | 16% | 50% | 94% | ≥99% | ≥99% | ≥99% |
| 200 yd | 16% | 50% | 94% | ≥99% | ≥99% | ≥99% |
| 300 yd | 16% | 50% | 94% | 99% | ≥99% | 98% |
| 400 yd | 16% | 50% | 94% | 94% | 99% | 92% |
| 500 yd | 16% | 50% | 94% | 83% | 94% | 83% |
| 600 yd | 16% | 50% | 94% | 71% | 85% | 74% |
| 700 yd | 16% | 50% | 94% | 60% | 76% | 64% |
| 800 yd | 16% | 50% | 94% | 50% | 66% | 56% |
| 900 yd | 16% | 50% | 94% | 42% | 58% | 48% |
| 1000 yd | 16% | 50% | 94% | 36% | 50% | 42% |
| 1100 yd | 16% | 50% | 94% | 31% | 44% | 36% |
| 1200 yd | 16% | 50% | 94% | 27% | 38% | 32% |
Group 3
- Group Size
- 1.132"
- 1.13 MOA
- Mean Radius
- 0.388"
- 0.39 MOA
- Shots
- 5
Hit probability matrix — Group 3 · 100yd · MR 0.388″
Assumes shooter dispersion is the dominant error source and scales linearly with range. Doesn't model wind, MV SD, or BC uncertainty — those matter more as distance grows, so real-world hit rates at long range will typically be lower than shown.
| Range | 0.5 MOA | 1 MOA | 2 MOA | 8" | 10" | IPSC A |
|---|---|---|---|---|---|---|
| 100 yd (measured) | 28% | 73% | 99% | ≥99% | ≥99% | ≥99% |
| 200 yd | 28% | 73% | 99% | ≥99% | ≥99% | ≥99% |
| 300 yd | 28% | 73% | 99% | ≥99% | ≥99% | ≥99% |
| 400 yd | 28% | 73% | 99% | 99% | ≥99% | 98% |
| 500 yd | 28% | 73% | 99% | 96% | 99% | 95% |
| 600 yd | 28% | 73% | 99% | 90% | 97% | 89% |
| 700 yd | 28% | 73% | 99% | 82% | 93% | 82% |
| 800 yd | 28% | 73% | 99% | 73% | 87% | 75% |
| 900 yd | 28% | 73% | 99% | 64% | 80% | 68% |
| 1000 yd | 28% | 73% | 99% | 57% | 73% | 62% |
| 1100 yd | 28% | 73% | 99% | 50% | 66% | 56% |
| 1200 yd | 28% | 73% | 99% | 44% | 60% | 50% |
Group 4
- Group Size
- 0.895"
- 0.90 MOA
- Mean Radius
- 0.308"
- 0.31 MOA
- Shots
- 5
Hit probability matrix — Group 4 · 100yd · MR 0.308″
Assumes shooter dispersion is the dominant error source and scales linearly with range. Doesn't model wind, MV SD, or BC uncertainty — those matter more as distance grows, so real-world hit rates at long range will typically be lower than shown.
| Range | 0.5 MOA | 1 MOA | 2 MOA | 8" | 10" | IPSC A |
|---|---|---|---|---|---|---|
| 100 yd (measured) | 40% | 87% | ≥99% | ≥99% | ≥99% | ≥99% |
| 200 yd | 40% | 87% | ≥99% | ≥99% | ≥99% | ≥99% |
| 300 yd | 40% | 87% | ≥99% | ≥99% | ≥99% | ≥99% |
| 400 yd | 40% | 87% | ≥99% | ≥99% | ≥99% | ≥99% |
| 500 yd | 40% | 87% | ≥99% | ≥99% | ≥99% | 99% |
| 600 yd | 40% | 87% | ≥99% | 97% | ≥99% | 96% |
| 700 yd | 40% | 87% | ≥99% | 93% | 99% | 92% |
| 800 yd | 40% | 87% | ≥99% | 87% | 96% | 87% |
| 900 yd | 40% | 87% | ≥99% | 81% | 92% | 81% |
| 1000 yd | 40% | 87% | ≥99% | 73% | 87% | 76% |
| 1100 yd | 40% | 87% | ≥99% | 67% | 82% | 70% |
| 1200 yd | 40% | 87% | ≥99% | 60% | 76% | 65% |
Group 5
- Group Size
- 1.468"
- 0.49 MOA
- Mean Radius
- 0.557"
- 0.19 MOA
- Shots
- 5
Hit probability matrix — Group 5 · 300yd · MR 0.557″
Assumes shooter dispersion is the dominant error source and scales linearly with range. Doesn't model wind, MV SD, or BC uncertainty — those matter more as distance grows, so real-world hit rates at long range will typically be lower than shown.
| Range | 0.5 MOA | 1 MOA | 2 MOA | 8" | 10" | IPSC A |
|---|---|---|---|---|---|---|
| 100 yd | 76% | ≥99% | ≥99% | ≥99% | ≥99% | ≥99% |
| 200 yd | 76% | ≥99% | ≥99% | ≥99% | ≥99% | ≥99% |
| 300 yd (measured) | 76% | ≥99% | ≥99% | ≥99% | ≥99% | ≥99% |
| 400 yd | 76% | ≥99% | ≥99% | ≥99% | ≥99% | ≥99% |
| 500 yd | 76% | ≥99% | ≥99% | ≥99% | ≥99% | ≥99% |
| 600 yd | 76% | ≥99% | ≥99% | ≥99% | ≥99% | ≥99% |
| 700 yd | 76% | ≥99% | ≥99% | ≥99% | ≥99% | ≥99% |
| 800 yd | 76% | ≥99% | ≥99% | ≥99% | ≥99% | 99% |
| 900 yd | 76% | ≥99% | ≥99% | 99% | ≥99% | 98% |
| 1000 yd | 76% | ≥99% | ≥99% | 97% | ≥99% | 96% |
| 1100 yd | 76% | ≥99% | ≥99% | 95% | 99% | 93% |
| 1200 yd | 76% | ≥99% | ≥99% | 92% | 98% | 91% |
Group 6
- Group Size
- 4.276"
- 1.43 MOA
- Mean Radius
- 1.137"
- 0.38 MOA
- Shots
- 5
Hit probability matrix — Group 6 · 300yd · MR 1.137″
Assumes shooter dispersion is the dominant error source and scales linearly with range. Doesn't model wind, MV SD, or BC uncertainty — those matter more as distance grows, so real-world hit rates at long range will typically be lower than shown.
| Range | 0.5 MOA | 1 MOA | 2 MOA | 8" | 10" | IPSC A |
|---|---|---|---|---|---|---|
| 100 yd | 29% | 75% | ≥99% | ≥99% | ≥99% | ≥99% |
| 200 yd | 29% | 75% | ≥99% | ≥99% | ≥99% | ≥99% |
| 300 yd (measured) | 29% | 75% | ≥99% | ≥99% | ≥99% | ≥99% |
| 400 yd | 29% | 75% | ≥99% | ≥99% | ≥99% | 99% |
| 500 yd | 29% | 75% | ≥99% | 97% | ≥99% | 95% |
| 600 yd | 29% | 75% | ≥99% | 91% | 98% | 90% |
| 700 yd | 29% | 75% | ≥99% | 83% | 94% | 84% |
| 800 yd | 29% | 75% | ≥99% | 75% | 88% | 77% |
| 900 yd | 29% | 75% | ≥99% | 66% | 82% | 70% |
| 1000 yd | 29% | 75% | ≥99% | 58% | 75% | 63% |
| 1100 yd | 29% | 75% | ≥99% | 51% | 68% | 57% |
| 1200 yd | 29% | 75% | ≥99% | 46% | 61% | 51% |
Group 7
- Group Size
- 3.096"
- 1.03 MOA
- Mean Radius
- 1.213"
- 0.40 MOA
- Shots
- 5
Hit probability matrix — Group 7 · 300yd · MR 1.213″
Assumes shooter dispersion is the dominant error source and scales linearly with range. Doesn't model wind, MV SD, or BC uncertainty — those matter more as distance grows, so real-world hit rates at long range will typically be lower than shown.
| Range | 0.5 MOA | 1 MOA | 2 MOA | 8" | 10" | IPSC A |
|---|---|---|---|---|---|---|
| 100 yd | 26% | 70% | 99% | ≥99% | ≥99% | ≥99% |
| 200 yd | 26% | 70% | 99% | ≥99% | ≥99% | ≥99% |
| 300 yd (measured) | 26% | 70% | 99% | ≥99% | ≥99% | ≥99% |
| 400 yd | 26% | 70% | 99% | 99% | ≥99% | 98% |
| 500 yd | 26% | 70% | 99% | 95% | 99% | 94% |
| 600 yd | 26% | 70% | 99% | 88% | 96% | 87% |
| 700 yd | 26% | 70% | 99% | 79% | 91% | 80% |
| 800 yd | 26% | 70% | 99% | 70% | 85% | 73% |
| 900 yd | 26% | 70% | 99% | 61% | 77% | 66% |
| 1000 yd | 26% | 70% | 99% | 54% | 70% | 59% |
| 1100 yd | 26% | 70% | 99% | 47% | 63% | 53% |
| 1200 yd | 26% | 70% | 99% | 41% | 57% | 47% |
Group 8
- Group Size
- 6.749"
- 2.25 MOA
- Mean Radius
- 2.223"
- 0.74 MOA
- Shots
- 5
Hit probability matrix — Group 8 · 300yd · MR 2.223″
Assumes shooter dispersion is the dominant error source and scales linearly with range. Doesn't model wind, MV SD, or BC uncertainty — those matter more as distance grows, so real-world hit rates at long range will typically be lower than shown.
| Range | 0.5 MOA | 1 MOA | 2 MOA | 8" | 10" | IPSC A |
|---|---|---|---|---|---|---|
| 100 yd | 9% | 30% | 76% | ≥99% | ≥99% | ≥99% |
| 200 yd | 9% | 30% | 76% | ≥99% | ≥99% | 99% |
| 300 yd (measured) | 9% | 30% | 76% | 92% | 98% | 91% |
| 400 yd | 9% | 30% | 76% | 76% | 89% | 78% |
| 500 yd | 9% | 30% | 76% | 60% | 76% | 65% |
| 600 yd | 9% | 30% | 76% | 47% | 63% | 53% |
| 700 yd | 9% | 30% | 76% | 37% | 52% | 43% |
| 800 yd | 9% | 30% | 76% | 30% | 43% | 36% |
| 900 yd | 9% | 30% | 76% | 25% | 36% | 30% |
| 1000 yd | 9% | 30% | 76% | 20% | 30% | 25% |
| 1100 yd | 9% | 30% | 76% | 17% | 26% | 21% |
| 1200 yd | 9% | 30% | 76% | 15% | 22% | 18% |
Notes
Wind picked up (11mph+) during the 300yd shots, not sure how much (if it all) it contributed to any accuracy issues.